

Third Quarter: The Fed Pivot
“It all comes down to interest rates. As an investor, all you’re doing is putting up a lump-sum payment for a future cash flow.” – Ray Dalio
The third quarter brought another round of strong returns for both stock and bond investors, notwithstanding a few speed bumps along the way. A softer-than-expected jobs report for July sent stocks into a tailspin in early August, and the S&P 500 was knocking on the door of a correction, falling nearly 10% over the course of a week. Volatility spiked from abnormally low levels, and worries of an imminent recession took hold. Adding fuel to the fire was the unwind of leveraged funds betting on the Yen carry trade, which lost money quickly as the Japanese Yen rapidly appreciated relative to the U.S. dollar. However, the sell-off, and subsequent volatility, was short-lived. Volatility has since returned to much more normal levels, and the market rebounded as recession fears waned. As we head into the final quarter of 2024, the S&P 500 has returned to near-record highs, and the breadth of the rally in stocks has expanded. All told, a globally diversified 60% equity (MSCI ACWI Index) / 40% bond (Bloomberg Global Aggregate) portfolio returned approximately 7% for investors during the quarter, and nearly 13% so far this year.
Stocks – Impressive Rally Continues
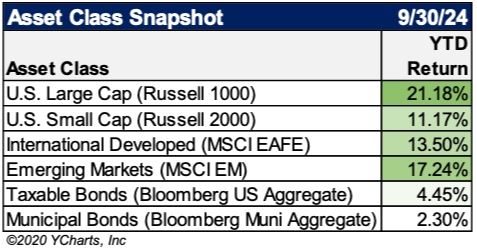
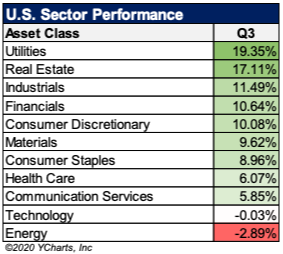
It was another rewarding quarter for equity investors, particularly for those diversified beyond the U.S. large caps. The S&P 500 posted a total return of nearly 6% in the second quarter. Meanwhile, small cap stocks rallied more than 9% for the month, reaping the benefits of lower interest-rate expectations. Interest-rate sensitive sectors led the way higher, with both the Utilities and Real Estate sectors rallying more than 15% during the quarter.
International developed and emerging market stocks saw a strong quarter as well, rallying 7.3% and 8.9%, respectively. Stocks in China saw a significant rally to finish off September in response to the enactment of several monetary and fiscal measures aimed at stabilizing the economy and stabilizing growth. After struggling for the past several years, the MSCI China index has rallied nearly 30% in total return so far in 2024.
Market Breadth Expands
In last quarter’s commentary, we discussed the widening disperion in performance betwewen the megacap tech stocks here in the U.S. and the rest of the market. The third quarter saw that trend reverse, with a much broader set of stocks leading the way higher. According to The Compound Media, 328 of S&P 500 stocks outperformed the S&P 500 during the third quarter, with only 109 stocks finishing the quarter in negative territory. Over the past quarter, nine of the 11 S&P 500 sectors posted positive returns, a stark contrast to the second quarter. Meanwihle, small cap stocks, international develop stocks, and emerging market stocks all outperformed the S&P 500 during the quarter. We believe this trend could persist as earnings growth broadens, which should support the merits of diversification within equities.
Bonds – Yields Lower, Bonds Price Higher
Interest rates moved markedly lower over the course of the third quarter, translating into strong total returns for fixed income investors. The Bloomberg taxable bond index finished the quarter higher by 5.2% in total return, while the Bloomberg municipal bond index finished higher by 2.7% in total return. After starting the quarter around 4.4%, the yield on the 10-year Treasury Note finished September trading around 3.80%. Notably, for the first time in more than two years, the yield curve is no longer inverted, with the 2-year Treasury note finishing the month around 3.65%. This reflects the most recent interest-rate cut enacted by the Federal Reserve, as well as expectations for further cuts down the road, which have an outsized impact on short-term interest rates (like the 2-year Treasury) relative to longer term bonds. For investors parking cash in money markets, CDs, and other short-term instruments, these rates are likely to move considerably lower over the next several months.
Federal Reserve – How Fast and How Far
The most recent FOMC policy-setting meeting in September brought a major shift in monetary policy. The Federal Reserve had held interest rates steady since July 2023, but for the first time in more than four years the Federal enacted an interest-rate cut in September. The markets were expecting the Fed to cut rates, but the 50-basis-point cut delivered by the central bank was more than many expected, bringing the upper-end of the fed funds rate from 5.5% to 5%. This interest-rate cut comes as the Fed shifts its focus from stomping out inflation to steering the economy away from a recession. Inflation has cooled significantly over the past couple of years and, after peaking at more than 9% in 2022, currently sits around 2.5%. However, the labor market has slowed as well, with the unemployment rate creeping higher from near-record-lows to around 4.2% today. Looking ahead, we can expect to see interest rates continue to move lower; however, the questions are how fast, and how far will the Fed go? As of this writing, the futures markets are pricing in 75 basis points of additional rate cuts between now and the end of the year. Looking further out, the markets expect to see as much as 200 basis points in rate cuts by the end of next year. This would leave short-term interest rates around 3% by the end of next year, a significant move lower from the peak of this cycle at 5.5%.
Economy – Labor Market Slows
Economic indicators in the third quarter continued to point toward an economy that will avoid a recession, at least in the near-term. The final estimate of second-quarter GDP showed the U.S. economy expanded at a 3% annualized rate. Looking forward, the Atlanta Fed’s GDP Now model projects real GDP growth of 3.1% for the third quarter of this year. On the labor front, the most recent nonfarm payrolls report showed the U.S. economy added 142,000 jobs in August, a solid number, but well below the rate of increase seen earlier this year.
We’ve also seen some significant revisions lower to previous numbers, and the unemployment rate has moved higher, from around 3.5% in the spring of 2023 to 4.2% today. In aggregate, this indicates a normalization of what had been a red-hot labor market coming out of the Covid-19 pandemic. We continue to keep a close eye on the health of the U.S. consumer, which accounts for approximately two-thirds of U.S. GDP. For now, all signs continue to point toward a resilient U.S. consumer, as retail sales beat expectations in August.
Outlook – Politics and Portfolios
Looking ahead to the final quarter of 2024, we must confront the elephant in the room, which is the fast-approaching presidential election between former President Donald Trump and current Vice President Kamala Harris. As we navigate this environment of heightened political polarization, we focus on providing independent market and economic research, regardless of which political party or candidate is in power. For investors, it is crucial to sift through the noise of partisan politics and focus on the facts. Remember, campaign rhetoric about policy often differs from actual policy implementation. Historically speaking, investors are often on edge leading up to election day, leading to elevated volatility in the markets. However, this is typically short-lived, and the markets have tended to rally in the months following election day. Either candidate will face the challenges of a slowing economy, growing national debt, along with heightened geopolitical tensions around the globe. Regardless of who takes office, the path forward for the markets will be influenced by corporate earnings growth and the direction of the economy, both of which are largely out of the control of any one candidate. With that said, we urge our clients to vote with their ballot this November, not their portfolio.
Please let me know if you would like to set up a meeting to discuss any questions about your portfolio.
This letter was created by a third party and was not written or created by the Advisor named above.
Asset allocation and diversification do not assure or guarantee better performance and cannot eliminate the risk of investment losses.
Investments in individual sectors may be more volatile than investments that diversify across many industry sectors and companies. Certain sectors of the market may expose an investor to more risk than others.
An investment cannot be made directly into an index.
Securities offered through Avantax Investment Services℠, Member FINRA, SIPC. Investment advisory services offered through Avantax Advisory Services℠ and Avantax Planning PartnersSM. Insurance services offered through licensed agents of Avantax Insurance Agency℠, Avantax Insurance Services℠, and Avantax Planning Partners. 3200 Olympus Blvd., Suite 100, Dallas, TX 75019, 972-870-6000.
Although Avantax does not provide or supervise tax or accounting services, our Financial Professionals may offer these services through their independent outside business. Not all Financial Professionals are licensed to offer all products or services. Financial planning and investment advisory services require separate licenses. For additional information ask your Financial Professional or contact us toll-free at (888) 438-3781.The S&P 500 Index is a market capitalization-weighted index composed of the 500 most widely held stocks whose assets and/or revenues are based in the U.S. The MSCI World ex USA All Cap Index is a free float-adjusted market capitalization equity index tracking performance in the global developed markets. The MSCI Emerging Markets Index is a free float-adjusted market capitalization equity index tracking performance in the global emerging markets. The Bloomberg Barclays U.S. Aggregate Bond Index is a broad-based index measuring the investment grade, U.S. dollar-denominated, fixed-rate taxable bond market, and includes Treasuries, government-related and corporate securities, MBS, ABS, and CMBS. The Bloomberg Barclays Municipal Bond Index is a rules-based, market-value-weighted index measuring the U.S. dollar-denominated long-term tax-exempt bond market and includes four main sectors: state and local GO, revenue, insured, and pre-refunded bonds. The indices referred to herein are for comparative purposes only and are not necessarily intended to parallel any particular investment vehicle or strategy. Indices are neither managed, nor accessible through direct investment, nor subject to advisory fees or other expenses.
Sources: Blackrock, JP Morgan, Bloomberg, Goldman Sachs, Morningstar, and YCharts. This material is being provided for informational purpose only and was obtained from sources deemed to be reliable. It is not represented as being complete, and its accuracy is not guaranteed. The information and opinions given are subject to change at any time based on market and other conditions and are not recommendations of or solicitations to buy or sell any security. Opinions and forecasts expressed herein might not actually occur.
The Russell 1000 ℠ Growth Index is an unmanaged market capitalization-weighted index of those stocks of the 1,000 largest U.S. domiciled companies that exhibit growth-oriented characteristics.
The Russell 2000 ℠ Index is an unmanaged market capitalization-weighted index measuring the performance of the smallest 2,000 companies in the Russell 3000 ℠ Index.
The MSCI ACWI Index is a global equity index that tracks large and mid-cap companies across 23 developed and 24 emerging markets.
The MSCI China Index captures large and mid-cap representation across China-based companies, covering sectors in both onshore and offshore markets.
Gross Domestic Product (GDP) measures the total market value of all goods and services produced within a country over a specific time period, reflecting its economic performance.